Categorie in Indramayu
Industrie
Distribuzione delle attività per settore in Indramayu
| Descrizione del settore | Numero di stabilimenti | Età media degli affari |
|---|---|---|
| Shopping | 10,936 | — |
| Ristoranti | 5,212 | — |
| Bar | 3,954 | — |
| Istruzione | 3,037 | 41 years |
| Negozi di alimentari e supermercati | 2,791 | — |
| Religione | 2,723 | — |
| Negozi di abbigliamento | 2,052 | — |
| Moschee | 1,769 | — |
| Altri alloggi | 1,682 | — |
| Gestione aziendale | 1,585 | — |
| Negozi di elettronica | 1,350 | — |
| Cibi e bevande | 1,144 | — |
Fatti su Indramayu
| Superficie | 535.3 km² |
| Popolazione | 867.120 |
| Popolazione maschile | 446.470 (51.5%) |
| Popolazione femminile | 420.650 (48.5%) |
| Variazione della popolazione (1975 to 2020) | +49.4% |
| Variazione della popolazione (2000 to 2020) | +7.4% |
| Età media | 28.7 anni (Maschi: 28, Femmine: 29.5) |
| Prefissi | 23, 234 |
| Quartieri | Karanganyar, Indramayu Sub-District, Jatibarang, Lemahmekar, Indramayu Sub-District, Margadadi, Indramayu Sub-District, Patrol |
| Ora locale | |
| Fuso orario | Ora dell’Indonesia occidentale |
| Lat. e long. | -6.32639, 108.32000 |
| Codici Postali | 45211, 45212, 45213, 45214, 45215, More |
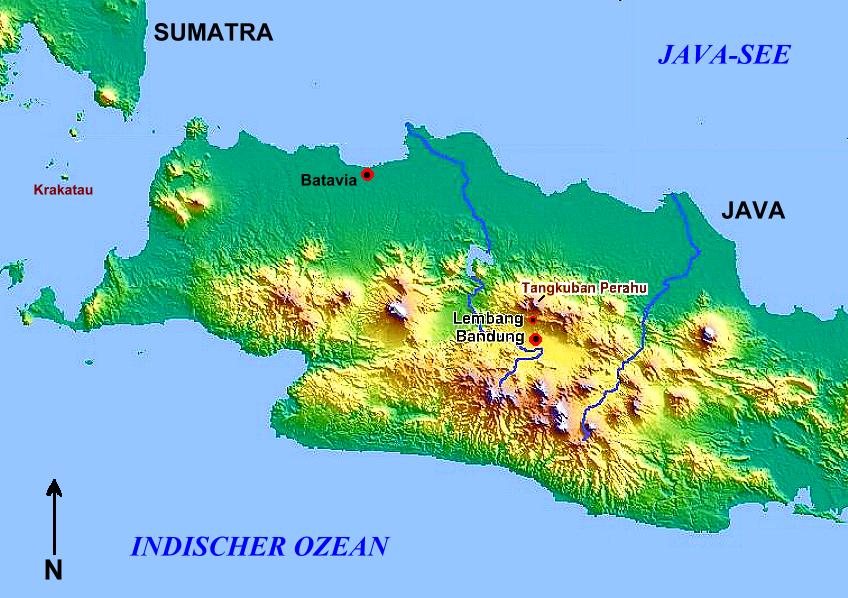
Mappa Indramayu
Mappa interattiva
Popolazione di Indramayu
Anni dal 1975 al 2020
| Data | 1975 | 1990 | 2000 | 2015 | 2020 |
|---|---|---|---|---|---|
| Popolazione | 580.528 | 749.451 | 807.256 | 830.304 | 867.120 |
| Densità demografica | 1084,6 / km² | 1400,2 / km² | 1508,2 / km² | 1551,2 / km² | 1620 / km² |
Variazione della popolazione di Indramayu dal 2000 al 2015
Aumento del 2.9% dall'anno 2000 al 2015
| Luogo | Variazione dal 1975 | Variazione dal 1990 | Variazione dal 2000 |
|---|---|---|---|
| Indramayu | +43% | +10.8% | +2.9% |
| Giava Occidentale | +216.6% | +80.7% | +44.2% |
| Indonesia | +96.9% | +41.9% | +21.7% |
Età mediana di Indramayu
Età mediana: 28.7 anni
| Luogo | Età media | Età mediana (femmina) | Età mediana (maschio) |
|---|---|---|---|
| Indramayu | 28.7 yrs | 29.5 yrs | 28 yrs |
| Giava Occidentale | 26.2 yrs | 26.2 yrs | 26.2 yrs |
| Indonesia | 27.2 yrs | 27.5 yrs | 26.9 yrs |
Densità di popolazione di Indramayu
Densità di popolazione: 1620 / km²
| Luogo | Popolazione | Superficie | Densità |
|---|---|---|---|
| Indramayu | 867.120 | 535,3 km² | 1620 / km² |
| Giava Occidentale | 44.507 | 53,6 km² | 831 / km² |
| Indonesia | 252,8 million | 1.893.657,8 km² | 134 / km² |
Popolazione storica e prevista di Indramayu
Popolazione stimata dal 1400 al 2100
- JRC (Centro comune di ricerca della Commissione europea) lavoro su GHS built-up grid
- CIESIN (Center for International Earth Science Information Network)
- [collegamento] Klein Goldewijk, K., Beusen, A., Doelman, J., and Stehfest, E.: Anthropogenic land use estimates for the Holocene – HYDE 3.2, Earth Syst. Sci. Data, 9, 927–953, https://doi.org/10.5194/essd-9-927-2017, 2017.
Quartieri di Indramayu
Percentuale di aziende per quartiere a Indramayu
Prefissi
Percentuale prefissi usati dalle imprese in Indramayu
Codici Postali
Percentuale di aziende per codice postale a Indramayu
Distribuzione dei prezzi
Distribuzione delle imprese per prezzo per Indramayu
Indice di sviluppo umano (HDI)
Indice composito statistico di aspettativa di vita, istruzione e reddito pro capite.
Emissioni di CO2 di Indramayu
Emissioni di anidride carbonica (CO2) pro capite in tonnellate all'anno
| Luogo | Emissioni di CO2 | Emissioni di CO2 pro capite | Intensità di emissioni di CO2 |
|---|---|---|---|
| Indramayu | 1,527,480 tn | 1.76 tn | 2,853.8 tons/km² |
| Giava Occidentale | 91,689 tn | 2.06 tn | 1,711.5 tons/km² |
| Indonesia | 478,610,416 tn | 1.89 tn | 252.7 tons/km² |
| Emissioni di CO2 del 2013 (tonnellate/anno) | 1,527,480 tn |
| Emissioni di CO2 del 2013 (tonnellate/anno) pro capite | 1.76 tn |
| Intensità delle emissioni di CO2 del 2013 (tonnellate/km²/anno) | 2,853.8 tons/km² |
Rischio pericoli naturali
Relative risk out of 10
| Pericolo | Risk Level |
|---|---|
| Drought | Medium (5) |
| Flood | High (10) |
| Earthquake | Medium (6.6) |
| Volcano | Medium (5) |
* Risk, particularly concerning flood or landslide, may not be for the entire area.
- Dilley, M., R.S. Chen, U. Deichmann, A.L. Lerner-Lam, M. Arnold, J. Agwe, P. Buys, O. Kjekstad, B. Lyon, and G. Yetman. 2005. Natural Disaster Hotspots: A Global Risk Analysis. Washington, D.C.: World Bank. https://doi.org/10.1596/0-8213-5930-4.
- Center for Hazards and Risk Research - CHRR - Columbia University, Center for International Earth Science Information Network - CIESIN - Columbia University, and International Research Institute for Climate and Society - IRI - Columbia University. 2005. Global Drought Hazard Frequency and Distribution. Palisades, NY: NASA Socioeconomic Data and Applications Center (SEDAC). https://doi.org/10.7927/H4VX0DFT.
- Center for Hazards and Risk Research - CHRR - Columbia University, Center for International Earth Science Information Network - CIESIN - Columbia University. 2005. Global Flood Hazard Frequency and Distribution. Palisades, NY: NASA Socioeconomic Data and Applications Center (SEDAC). https://doi.org/10.7927/H4668B3D.
- Center for Hazards and Risk Research - CHRR - Columbia University, Center for International Earth Science Information Network - CIESIN - Columbia University. 2005. Global Volcano Hazard Frequency and Distribution. Palisades, NY: NASA Socioeconomic Data and Applications Center (SEDAC). https://doi.org/10.7927/H4BR8Q45.
- Center for Hazards and Risk Research - CHRR - Columbia University, Center for International Earth Science Information Network - CIESIN - Columbia University. 2005. Global Earthquake Hazard Distribution - Peak Ground Acceleration. Palisades, NY: NASA Socioeconomic Data and Applications Center (SEDAC). https://doi.org/10.7927/H4BZ63ZS.
Recenti terremoti nelle vicinanze
Magnitudo 3.0 e successive
| Data▼ | Ora↕ | Magnitude↕ | Distance↕ | Profondità↕ | Luogo↕ | collegamento |
|---|---|---|---|---|---|---|
| 12/7/18 | 1:49 PM | 4.2 | 29 km | 265,170 m | 8km N of Arjawinangun, Indonesia | usgs.gov |
| 11/15/18 | 3:16 PM | 4 | 37 km | 312,100 m | 26km NNE of Masjid Jamie Baitul Muttaqien, Indonesia | usgs.gov |
| 8/21/18 | 9:23 PM | 4.3 | 73 km | 231,990 m | 7km E of Karangsembung, Indonesia | usgs.gov |
| 5/14/18 | 1:50 PM | 4 | 97.1 km | 275,980 m | 54km NE of Rengasdengklok, Indonesia | usgs.gov |
| 2/11/18 | 6:48 AM | 4 | 52 km | 242,260 m | 10km SSW of Palimanan, Indonesia | usgs.gov |
| 9/25/17 | 8:08 PM | 4.2 | 81.9 km | 306,630 m | 45km N of Pamanukan, Indonesia | usgs.gov |
| 7/31/16 | 10:46 AM | 4.2 | 62.7 km | 180,240 m | 11km NNE of Sumedang Utara, Indonesia | usgs.gov |
| 5/12/16 | 12:21 AM | 4.4 | 95.1 km | 171,670 m | 6km E of Bandung, Indonesia | usgs.gov |
| 1/25/16 | 12:54 PM | 4.2 | 39.3 km | 241,110 m | 13km NW of Jatiwangi, Indonesia | usgs.gov |
| 3/10/15 | 12:59 AM | 4 | 52 km | 284,750 m | 17km NNE of Pamanukan, Indonesia | usgs.gov |


Informazioni sui nostri dati
I dati di questa pagina sono stimati utilizzando vari strumenti e risorse pubblicamente disponibili. Sono forniti senza garanzia e potrebbero contenere imprecisioni. Utilizzare a proprio rischio.