Categorie in Govardhan
Industrie
Distribuzione delle attività per settore in Govardhan
| Descrizione del settore | Numero di stabilimenti | Valutazione media di Google |
|---|---|---|
| Religione | 32 | 4.6 |
| Tempio hindu | 18 | 4.6 |
| Altri alloggi | 10 | 3.9 |
Fatti su Govardhan
| Superficie | 5.4 km² |
| Popolazione | 142.609 |
| Popolazione maschile | 76.502 (53.6%) |
| Popolazione femminile | 66.107 (46.4%) |
| Variazione della popolazione (1975 to 2020) | -29.0% |
| Variazione della popolazione (2000 to 2020) | +6.2% |
| Età media | 20.8 anni (Maschi: 20.4, Femmine: 21.3) |
| Quartieri | Deeg Adda, Thiruvadamathura, Gangapur, hathi darwaza, Bada Bazar |
| Ora locale | |
| Fuso orario | Ora standard dell’India |
| Lat. e long. | 27.49658, 77.46263 |
Mappa Govardhan
Mappa interattiva
Popolazione di Govardhan
Anni dal 1975 al 2020
| Data | 1975 | 1990 | 2000 | 2015 | 2020 |
|---|---|---|---|---|---|
| Popolazione | 200.733 | 125.690 | 134.272 | 133.916 | 142.609 |
| Densità demografica | 36.916,4 / km² | 23.115,4 / km² | 24.693,7 / km² | 24.628,2 / km² | 26.226,9 / km² |
Variazione della popolazione di Govardhan dal 2000 al 2015
Diminuzione del 0.3% dall'anno 2000 al 2015
| Luogo | Variazione dal 1975 | Variazione dal 1990 | Variazione dal 2000 |
|---|---|---|---|
| Govardhan | -33.3% | +6.5% | -0.3% |
| Uttar Pradesh | +134.1% | +59.5% | +28.4% |
| India | +111.1% | +50.6% | +24.5% |
Età mediana di Govardhan
Età mediana: 20.8 anni
| Luogo | Età media | Età mediana (femmina) | Età mediana (maschio) |
|---|---|---|---|
| Govardhan | 20.8 yrs | 21.3 yrs | 20.4 yrs |
| Uttar Pradesh | 21.4 yrs | 21.7 yrs | 21 yrs |
| India | 24.9 yrs | 25.4 yrs | 24.5 yrs |
Densità di popolazione di Govardhan
Densità di popolazione: 26.227 / km²
| Luogo | Popolazione | Superficie | Densità |
|---|---|---|---|
| Govardhan | 142.609 | 5,4 km² | 26.227 / km² |
| Uttar Pradesh | 217,8 million | 240.777,3 km² | 905 / km² |
| India | 1307 million | 3.083.563,4 km² | 424 / km² |
Popolazione storica e prevista di Govardhan
Popolazione stimata dal 0 al 2100
- JRC (Centro comune di ricerca della Commissione europea) lavoro su GHS built-up grid
- CIESIN (Center for International Earth Science Information Network)
- [collegamento] Klein Goldewijk, K., Beusen, A., Doelman, J., and Stehfest, E.: Anthropogenic land use estimates for the Holocene – HYDE 3.2, Earth Syst. Sci. Data, 9, 927–953, https://doi.org/10.5194/essd-9-927-2017, 2017.
Quartieri di Govardhan
Percentuale di aziende per quartiere a Govardhan
Indice di sviluppo umano (HDI)
Indice composito statistico di aspettativa di vita, istruzione e reddito pro capite.
Emissioni di CO2 di Govardhan
Emissioni di anidride carbonica (CO2) pro capite in tonnellate all'anno
| Luogo | Emissioni di CO2 | Emissioni di CO2 pro capite | Intensità di emissioni di CO2 |
|---|---|---|---|
| Govardhan | 199,861 tn | 1.4 tn | 36,756.1 tons/km² |
| Uttar Pradesh | 259,048,938 tn | 1.19 tn | 1,075.9 tons/km² |
| India | 1,928,568,344 tn | 1.48 tn | 625.4 tons/km² |
| Emissioni di CO2 del 2013 (tonnellate/anno) | 199,861 tn |
| Emissioni di CO2 del 2013 (tonnellate/anno) pro capite | 1.4 tn |
| Intensità delle emissioni di CO2 del 2013 (tonnellate/km²/anno) | 36,756.1 tons/km² |
Rischio pericoli naturali
Relative risk out of 10
| Pericolo | Risk Level |
|---|---|
| Drought | High (9) |
| Flood | High (10) |
| Earthquake | Medium (4) |
* Risk, particularly concerning flood or landslide, may not be for the entire area.
- Dilley, M., R.S. Chen, U. Deichmann, A.L. Lerner-Lam, M. Arnold, J. Agwe, P. Buys, O. Kjekstad, B. Lyon, and G. Yetman. 2005. Natural Disaster Hotspots: A Global Risk Analysis. Washington, D.C.: World Bank. https://doi.org/10.1596/0-8213-5930-4.
- Center for Hazards and Risk Research - CHRR - Columbia University, Center for International Earth Science Information Network - CIESIN - Columbia University, and International Research Institute for Climate and Society - IRI - Columbia University. 2005. Global Drought Hazard Frequency and Distribution. Palisades, NY: NASA Socioeconomic Data and Applications Center (SEDAC). https://doi.org/10.7927/H4VX0DFT.
- Center for Hazards and Risk Research - CHRR - Columbia University, Center for International Earth Science Information Network - CIESIN - Columbia University. 2005. Global Flood Hazard Frequency and Distribution. Palisades, NY: NASA Socioeconomic Data and Applications Center (SEDAC). https://doi.org/10.7927/H4668B3D.
- Center for Hazards and Risk Research - CHRR - Columbia University, Center for International Earth Science Information Network - CIESIN - Columbia University. 2005. Global Earthquake Hazard Distribution - Peak Ground Acceleration. Palisades, NY: NASA Socioeconomic Data and Applications Center (SEDAC). https://doi.org/10.7927/H4BZ63ZS.
Recenti terremoti nelle vicinanze
Magnitudo 3.0 e successive
| Data▼ | Ora↕ | Magnitude↕ | Distance↕ | Profondità↕ | Luogo↕ | collegamento |
|---|---|---|---|---|---|---|
| 3/16/19 | 11:41 PM | 4 | 58.9 km | 10,000 m | 11km W of Govindgarh, India | usgs.gov |
| 11/16/16 | 10:59 PM | 4.4 | 93.6 km | 10,000 m | 14km SE of Bawal, India | usgs.gov |
| 10/18/07 | 5:54 AM | 4.7 | 36.2 km | 10,000 m | Rajasthan-Uttar Pradesh border region, India | usgs.gov |
| 11/29/06 | 5:41 AM | 4 | 64.7 km | 10,000 m | Rajasthan, India | usgs.gov |
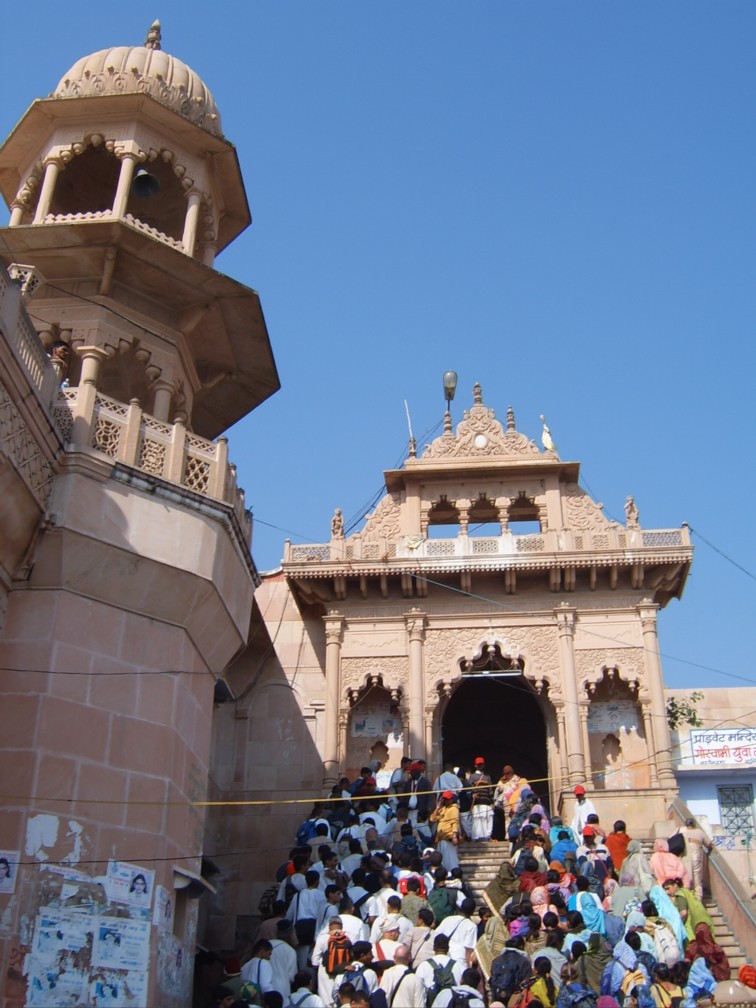
Govardhan
Govardhan (o Gobardhan, Goverdhan) è una suddivisione dell'India, classificata come nagar panchayat, di 18.512 abitanti, situata nel distretto di Mathura, nello stato federato dell'Uttar Pradesh. In base al numero di abitanti la città rientra nella classe IV (..
Pagina di Wikipedia per Govardhan
Informazioni sui nostri dati
I dati di questa pagina sono stimati utilizzando vari strumenti e risorse pubblicamente disponibili. Sono forniti senza garanzia e potrebbero contenere imprecisioni. Utilizzare a proprio rischio.