Categorie in Sheohar
Industrie
Distribuzione delle attività per settore in Sheohar
| Descrizione del settore | Numero di stabilimenti |
|---|---|
| Istruzione | 496 |
| Shopping | 490 |
| Tempio hindu | 296 |
| Shopping altro | 231 |
| Negozi di elettronica | 217 |
| Viaggi e trasporti | 159 |
| Negozi di abbigliamento | 139 |
| Negozi di alimentari e supermercati | 130 |
| Ferramenta | 112 |
Fatti su Sheohar
| Superficie | 6.3 km² |
| Popolazione | 51.456 |
| Popolazione maschile | 27.213 (52.9%) |
| Popolazione femminile | 24.243 (47.1%) |
| Variazione della popolazione (1975 to 2020) | +38.8% |
| Variazione della popolazione (2000 to 2020) | -33.0% |
| Età media | 20 anni (Maschi: 19.6, Femmine: 20.4) |
| Prefissi | 6222 |
| Quartieri | सितामरी जिला, Bisharasthan, Bombay Market, chhawni |
| Ora locale | |
| Fuso orario | Ora standard dell’India |
| Lat. e long. | 26.51393, 85.29341 |
| Codici Postali | 843325, 843329 |
Mappa Sheohar
Mappa interattiva
Popolazione di Sheohar
Anni dal 1975 al 2030
| Data | 1975 | 1990 | 2000 | 2015 | 2020 | 2025* | 2030* |
|---|---|---|---|---|---|---|---|
| Popolazione | 37.064 | 58.413 | 76.773 | 99.876 | 51.456 | 51.020 | 52.668 |
| Densità demografica | 5871,5 / km² | 9253,5 / km² | 12.162,1 / km² | 15.821,9 / km² | 8151,4 / km² | 8082,4 / km² | 8343,4 / km² |
Variazione della popolazione di Sheohar dal 2000 al 2020
Diminuzione del 33% dall'anno 2000 al 2020
| Luogo | Variazione dal 1975 | Variazione dal 1990 | Variazione dal 2000 |
|---|---|---|---|
| Sheohar | +38.8% | -11.9% | -33% |
| Bihar | — | — | — |
| India | — | — | — |
Età mediana di Sheohar
Età mediana: 20 anni
| Luogo | Età media | Età mediana (femmina) | Età mediana (maschio) |
|---|---|---|---|
| Sheohar | 20 yrs | 20.4 yrs | 19.6 yrs |
| Bihar | 20.4 yrs | 20.8 yrs | 20.1 yrs |
| India | 24.9 yrs | 25.4 yrs | 24.5 yrs |
Densità di popolazione di Sheohar
Densità di popolazione: 8151 / km²
| Luogo | Popolazione | Superficie | Densità |
|---|---|---|---|
| Sheohar | 51.456 | 6,3 km² | 8151 / km² |
| Bihar | 115,8 million | 94.107,8 km² | 1230 / km² |
| India | 1307 million | 3.083.563,4 km² | 424 / km² |
Popolazione storica e prevista di Sheohar
Popolazione stimata dal 0 al 2100
- JRC (Centro comune di ricerca della Commissione europea) lavoro su GHS built-up grid
- CIESIN (Center for International Earth Science Information Network)
- [collegamento] Klein Goldewijk, K., Beusen, A., Doelman, J., and Stehfest, E.: Anthropogenic land use estimates for the Holocene – HYDE 3.2, Earth Syst. Sci. Data, 9, 927–953, https://doi.org/10.5194/essd-9-927-2017, 2017.
Prefissi
Percentuale prefissi usati dalle imprese in Sheohar
Indice di sviluppo umano (HDI)
Indice composito statistico di aspettativa di vita, istruzione e reddito pro capite.
Emissioni di CO2 di Sheohar
Emissioni di anidride carbonica (CO2) pro capite in tonnellate all'anno
| Luogo | Emissioni di CO2 | Emissioni di CO2 pro capite | Intensità di emissioni di CO2 |
|---|---|---|---|
| Sheohar | 61,131 tn | 1.19 tn | 9,684.1 tons/km² |
| Bihar | 132,083,798 tn | 1.14 tn | 1,403.5 tons/km² |
| India | 1,928,568,344 tn | 1.48 tn | 625.4 tons/km² |
| Emissioni di CO2 del 2013 (tonnellate/anno) | 61,131 tn |
| Emissioni di CO2 del 2013 (tonnellate/anno) pro capite | 1.19 tn |
| Intensità delle emissioni di CO2 del 2013 (tonnellate/km²/anno) | 9,684.1 tons/km² |
Rischio pericoli naturali
Rischio relativo su 10
| Pericolo | Livello di rischio |
|---|---|
| Siccità | Medio (5) |
| Alluvione | Alto (10) |
| Terremoto | Medio (6) |
* Il rischio, in particolare per quanto riguarda inondazioni o frane, potrebbe non riguardare l'intera area.
- Dilley, M., R.S. Chen, U. Deichmann, A.L. Lerner-Lam, M. Arnold, J. Agwe, P. Buys, O. Kjekstad, B. Lyon, and G. Yetman. 2005. Natural Disaster Hotspots: A Global Risk Analysis. Washington, D.C.: World Bank. https://doi.org/10.1596/0-8213-5930-4.
- Center for Hazards and Risk Research - CHRR - Columbia University, Center for International Earth Science Information Network - CIESIN - Columbia University, and International Research Institute for Climate and Society - IRI - Columbia University. 2005. Global Drought Hazard Frequency and Distribution. Palisades, NY: NASA Socioeconomic Data and Applications Center (SEDAC). https://doi.org/10.7927/H4VX0DFT.
- Center for Hazards and Risk Research - CHRR - Columbia University, Center for International Earth Science Information Network - CIESIN - Columbia University. 2005. Global Flood Hazard Frequency and Distribution. Palisades, NY: NASA Socioeconomic Data and Applications Center (SEDAC). https://doi.org/10.7927/H4668B3D.
- Center for Hazards and Risk Research - CHRR - Columbia University, Center for International Earth Science Information Network - CIESIN - Columbia University. 2005. Global Earthquake Hazard Distribution - Peak Ground Acceleration. Palisades, NY: NASA Socioeconomic Data and Applications Center (SEDAC). https://doi.org/10.7927/H4BZ63ZS.
Recenti terremoti nelle vicinanze
Magnitudo 3.0 e successive
| Data▼ | Ora↕ | Magnitude↕ | Distance↕ | Profondità↕ | Luogo↕ | collegamento |
|---|---|---|---|---|---|---|
| 5/26/15 | 2:15 PM | 3.7 | 90.2 km | 10,000 m | 14km SSE of Hitura, Nepal | usgs.gov |
| 5/20/15 | 9:02 AM | 4.6 | 92.9 km | 10,000 m | 11km S of Hitura, Nepal | usgs.gov |
| 5/2/15 | 12:10 AM | 4 | 96.7 km | 10,000 m | 15km ESE of Hitura, Nepal | usgs.gov |
| 4/26/15 | 7:43 AM | 4.3 | 89.8 km | 10,000 m | 33km SSW of Ramechhap, Nepal | usgs.gov |
| 7/2/02 | 5:10 PM | 3.9 | 88.7 km | 33,000 m | Uttar Pradesh-Bihar border region, India | usgs.gov |
| 5/16/98 | 10:31 AM | 4.2 | 64 km | 33,000 m | Uttar Pradesh-Bihar border region, India | usgs.gov |
| 7/9/93 | 4:23 PM | 4.6 | 83 km | 33,000 m | Nepal-India border region | usgs.gov |
| 5/5/79 | 11:22 AM | 4.3 | 84.7 km | 33,000 m | Nepal | usgs.gov |
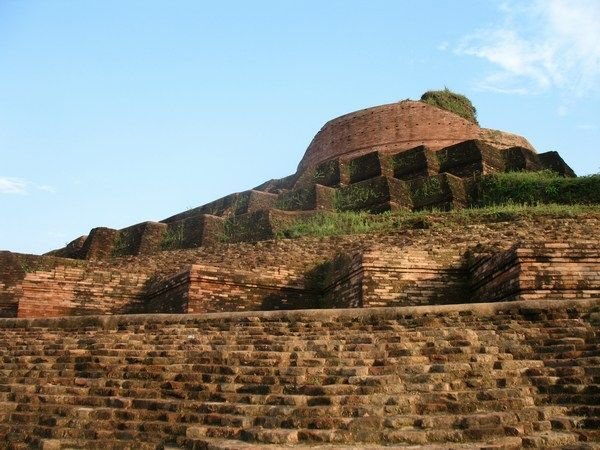
Sheohar
Sheohar è una città dell'India di 21.327 abitanti, capoluogo del distretto di Sheohar, nello stato federato del Bihar. In base al numero di abitanti la città rientra nella classe III (da 20.000 a 49.999 persone).
Pagina di Wikipedia per Sheohar

Informazioni sui nostri dati
I dati di questa pagina sono stimati utilizzando vari strumenti e risorse pubblicamente disponibili. Sono forniti senza garanzia e potrebbero contenere imprecisioni. Utilizzare a proprio rischio.