Categorie in Teheran
Industrie
Distribuzione delle attività per settore in Teheran
| Descrizione del settore | Numero di stabilimenti | Età media degli affari |
|---|---|---|
| Gestione aziendale | 27,300 | 28 years |
| Shopping | 26,272 | 27 years |
| Ristoranti | 12,921 | 13 years |
| Negozi di elettronica | 10,158 | 25 years |
| Negozi di alimentari e supermercati | 8,758 | — |
| Istruzione | 8,604 | 42 years |
| Negozi di abbigliamento | 8,336 | 28 years |
| Immobiliari | 8,154 | 22 years |
| Riparazione auto | 7,395 | — |
| Bar | 7,064 | — |
| Salute e medicina | 6,803 | — |
| Saloni di bellezza | 5,270 | — |
| Appartamenti | 5,208 | — |
Fatti su Teheran
| Superficie | 1654.1 km² |
| Popolazione | 7.563.713 |
| Popolazione maschile | 3.810.629 (50.4%) |
| Popolazione femminile | 3.753.084 (49.6%) |
| Variazione della popolazione (1975 to 2020) | +3177.1% |
| Variazione della popolazione (2000 to 2020) | +15.0% |
| Età media | 27.9 anni (Maschi: 27.8, Femmine: 28) |
| PIL pro capite (PPA) | $21.466 (2022) |
| Prefissi | 21 |
| Quartieri | District 6, District 3, District 2, District 1, District 7 |
| Ora locale | |
| Fuso orario | Ora standard dell’Iran |
| Lat. e long. | 35.69439, 51.42151 |
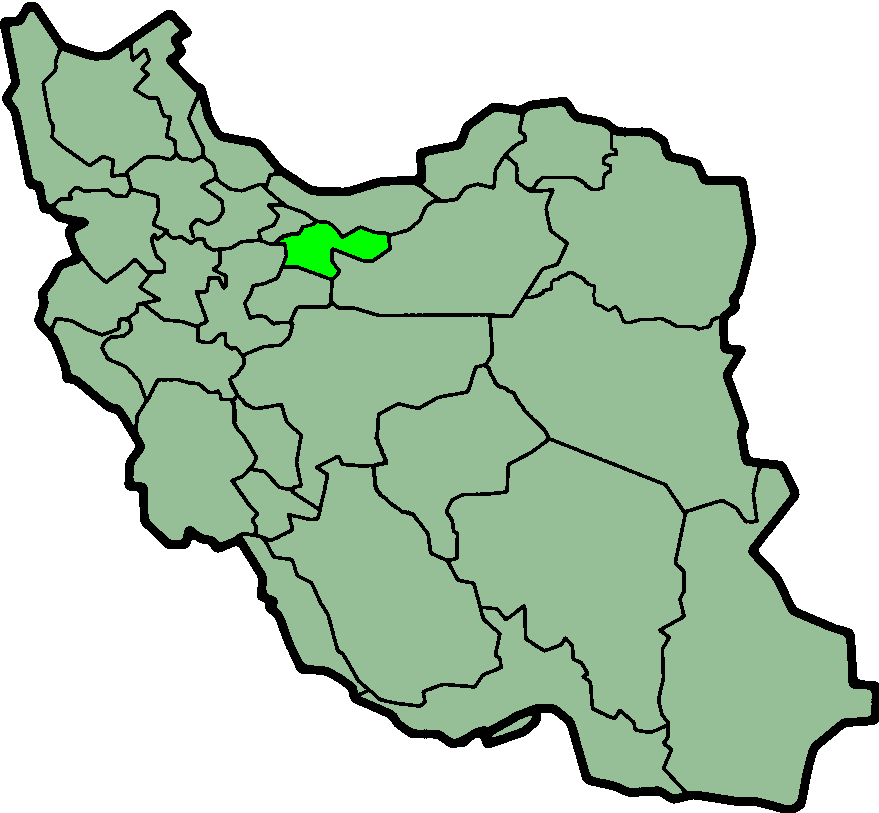
Mappa Teheran
Mappa interattiva
Popolazione di Teheran
Anni dal 1975 al 2030
| Data | 1975 | 1990 | 2000 | 2015 | 2020 | 2025* | 2030* |
|---|---|---|---|---|---|---|---|
| Popolazione | 230.806 | 3.735.528 | 6.576.101 | 8.776.770 | 7.563.713 | 8.044.958 | 8.501.550 |
| Densità demografica | 139,5 / km² | 2258,3 / km² | 3975,6 / km² | 5306 / km² | 4572,6 / km² | 4863,6 / km² | 5139,6 / km² |
Variazione della popolazione di Teheran dal 2000 al 2020
Aumento del 15% dall'anno 2000 al 2020
| Luogo | Variazione dal 1975 | Variazione dal 1990 | Variazione dal 2000 |
|---|---|---|---|
| Teheran | +3177.1% | +102.5% | +15% |
| Regione di Teheran | — | — | — |
| Iran | — | — | — |
Età mediana di Teheran
Età mediana: 27.9 anni
| Luogo | Età media | Età mediana (femmina) | Età mediana (maschio) |
|---|---|---|---|
| Teheran | 27.9 yrs | 28 yrs | 27.8 yrs |
| Regione di Teheran | 27.9 yrs | 28 yrs | 27.8 yrs |
| Iran | 27.9 yrs | 28 yrs | 27.8 yrs |
Densità di popolazione di Teheran
Densità di popolazione: 4573 / km²
| Luogo | Popolazione | Superficie | Densità |
|---|---|---|---|
| Teheran | 7,6 million | 1654,1 km² | 4573 / km² |
| Regione di Teheran | 12,6 million | 13.711,4 km² | 922 / km² |
| Iran | 79,1 million | 1.623.090,1 km² | 48,7 / km² |
Popolazione storica e prevista di Teheran
Popolazione stimata dal 1970 al 2100
- JRC (Centro comune di ricerca della Commissione europea) lavoro su GHS built-up grid
- CIESIN (Center for International Earth Science Information Network)
- [collegamento] Klein Goldewijk, K., Beusen, A., Doelman, J., and Stehfest, E.: Anthropogenic land use estimates for the Holocene – HYDE 3.2, Earth Syst. Sci. Data, 9, 927–953, https://doi.org/10.5194/essd-9-927-2017, 2017.
Quartieri di Teheran
Percentuale di aziende per quartiere a Teheran
Prefissi
Percentuale prefissi usati dalle imprese in Teheran
Distribuzione dei prezzi
Distribuzione delle imprese per prezzo per Teheran
Indice di sviluppo umano (HDI)
Indice composito statistico di aspettativa di vita, istruzione e reddito pro capite.
Prodotto Interno Lordo (PIL) di Teheran
PIL pro capite, PPA ($ internazionali costanti 2017)
| Data | 1990 | 1995 | 2000 | 2005 | 2010 | 2015 | 2020 | 2022 |
|---|---|---|---|---|---|---|---|---|
| PIL pro capite | $14.352 | $14.438 | $15.137 | $18.149 | $26.090 | $20.040 | $20.035 | $21.466 |
| PIL totale | $65 Mld | $66,9 Mld | $74,5 Mld | $93,7 Mld | $146,8 Mld | $122,2 Mld | $136,6 Mld | $149,1 Mld |
Emissioni di CO2 di Teheran
Emissioni di anidride carbonica (CO2) pro capite in tonnellate all'anno
| Luogo | Emissioni di CO2 | Emissioni di CO2 pro capite | Intensità di emissioni di CO2 |
|---|---|---|---|
| Teheran | 74,553,492 tn | 9.86 tn | 45,071.3 tons/km² |
| Regione di Teheran | 125,855,629 tn | 9.96 tn | 9,178.9 tons/km² |
| Iran | 601,639,824 tn | 7.6 tn | 370.7 tons/km² |
| Emissioni di CO2 del 2013 (tonnellate/anno) | 74,553,492 tn |
| Emissioni di CO2 del 2013 (tonnellate/anno) pro capite | 9.86 tn |
| Intensità delle emissioni di CO2 del 2013 (tonnellate/km²/anno) | 45,071.3 tons/km² |
Rischio pericoli naturali
Rischio relativo su 10
| Pericolo | Livello di rischio |
|---|---|
| Siccità | Medio (5) |
| Alluvione | Medio (7) |
| Terremoto | Alto (8.7) |
| Frana | Medio (6) |
* Il rischio, in particolare per quanto riguarda inondazioni o frane, potrebbe non riguardare l'intera area.
- Dilley, M., R.S. Chen, U. Deichmann, A.L. Lerner-Lam, M. Arnold, J. Agwe, P. Buys, O. Kjekstad, B. Lyon, and G. Yetman. 2005. Natural Disaster Hotspots: A Global Risk Analysis. Washington, D.C.: World Bank. https://doi.org/10.1596/0-8213-5930-4.
- Center for Hazards and Risk Research - CHRR - Columbia University, Center for International Earth Science Information Network - CIESIN - Columbia University, and Norwegian Geotechnical Institute - NGI. 2005. Global Landslide Hazard Distribution. Palisades, NY: NASA Socioeconomic Data and Applications Center (SEDAC). https://doi.org/10.7927/H4P848VZ.
- Center for Hazards and Risk Research - CHRR - Columbia University, Center for International Earth Science Information Network - CIESIN - Columbia University, and International Research Institute for Climate and Society - IRI - Columbia University. 2005. Global Drought Hazard Frequency and Distribution. Palisades, NY: NASA Socioeconomic Data and Applications Center (SEDAC). https://doi.org/10.7927/H4VX0DFT.
- Center for Hazards and Risk Research - CHRR - Columbia University, Center for International Earth Science Information Network - CIESIN - Columbia University. 2005. Global Flood Hazard Frequency and Distribution. Palisades, NY: NASA Socioeconomic Data and Applications Center (SEDAC). https://doi.org/10.7927/H4668B3D.
- Center for Hazards and Risk Research - CHRR - Columbia University, Center for International Earth Science Information Network - CIESIN - Columbia University. 2005. Global Earthquake Hazard Distribution - Peak Ground Acceleration. Palisades, NY: NASA Socioeconomic Data and Applications Center (SEDAC). https://doi.org/10.7927/H4BZ63ZS.
Recenti terremoti nelle vicinanze
Magnitudo 3.0 e successive
| Data▼ | Ora↕ | Magnitude↕ | Distance↕ | Profondità↕ | Luogo↕ | collegamento |
|---|---|---|---|---|---|---|
| 4/1/18 | 6:26 PM | 4 | 89.8 km | 10,000 m | 23km NNE of Istgah-e Garmsar, Iran | usgs.gov |
| 12/26/17 | 9:24 PM | 4 | 15.2 km | 10,000 m | 15km W of Tehran, Iran | usgs.gov |
| 12/20/17 | 7:57 PM | 4.9 | 41.9 km | 10,000 m | 2km SW of Malard, Iran | usgs.gov |
| 8/16/14 | 11:55 PM | 4.1 | 84.3 km | 8,000 m | 33km NE of Damavand, Iran | usgs.gov |
| 5/10/14 | 10:04 PM | 4.1 | 87.4 km | 10,000 m | 39km SSW of Amol, Iran | usgs.gov |
| 8/17/12 | 8:31 PM | 3.8 | 44 km | 7,300 m | northern Iran | usgs.gov |
| 2/10/12 | 8:59 AM | 4.7 | 91.2 km | 14,300 m | northern Iran | usgs.gov |
| 2/20/11 | 11:22 AM | 4.2 | 47.2 km | 7,000 m | northern Iran | usgs.gov |
| 6/4/07 | 8:04 AM | 3.9 | 81.1 km | 3,900 m | northern Iran | usgs.gov |
| 12/20/06 | 4:39 AM | 4.2 | 41.8 km | 14,100 m | northern Iran | usgs.gov |
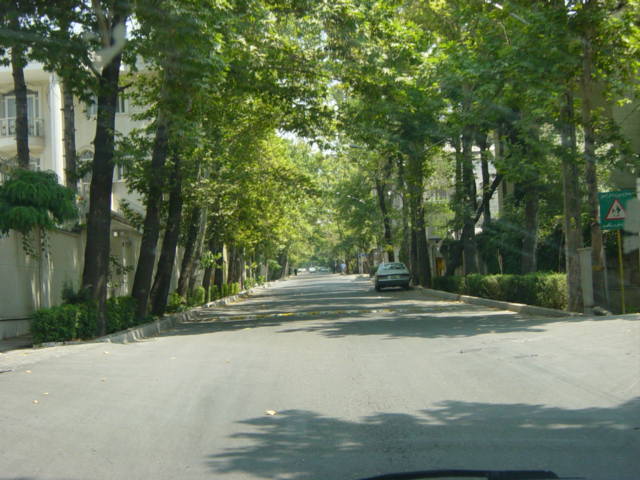
Teheran
Teheran (scritto anche Tehrān, تهران in persiano) è la capitale dell'Iran. Situata nel nord del paese, ai piedi dei monti Elburz, la città dona il nome alla provincia di cui è anche capoluogo. ha visto la sua popolazione aumentare progressivamente da quando è..
Pagina di Wikipedia per Teheran

Informazioni sui nostri dati
I dati di questa pagina sono stimati utilizzando vari strumenti e risorse pubblicamente disponibili. Sono forniti senza garanzia e potrebbero contenere imprecisioni. Utilizzare a proprio rischio.